
Investments
Investment Return
Each year, once the Scheme’s financial statements have been audited and the tax calculations completed, the Trustees declare a rate of return to be applied to your accounts in the Scheme. The same rate applies to all members and to all their accounts. The rate of return depends on the investment return on the Scheme’s assets, less taxes and certain expenses – this year -3.03%.
Each year the Trustees consider the appropriate level of the Reserve Account. For the year ended 31 March 2023, the Trustees agreed that the Reserve Account should be maintained at 0.5% of the total net assets, in line with the Trustees’ policy.
This year, the Trustees have allocated $68,187 from the Reserve Account to reduce the negative rate of return applied to members’ accounts.
The Reserve Account builds up each year when members leave the Scheme and are not entitled to the full balances in their Employer Subsidy Accounts.
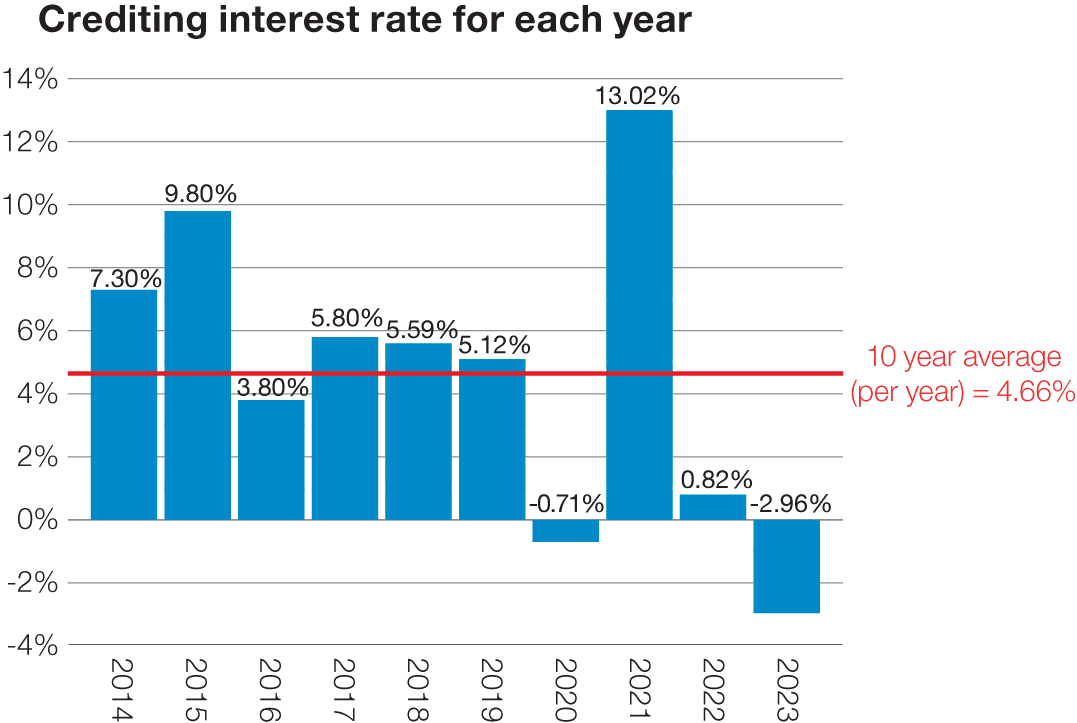
This year, your accounts have been updated with an investment return of -2.96%. The interim rates applied during the year are shown on page 7 of the Annual Report.
The following chart shows the investment returns credited to members’ account balances for the past decade. Although the Scheme has had its annual ups and downs, reflecting the conditions of the markets in which assets are invested, it has paid members an average return of 4.66% p.a. (after tax and expenses) over the last 10 years.
If you leave the Scheme during the year, an interim interest rate will be applied to your accounts. The interim rates applied during the year are shown on page 7 of the Annual Report.
The Scheme's Investment Managers
The Scheme’s assets are currently invested in a mix of equities, real assets (property and infrastructure), fixed interest, and cash and cash equivalents. The Trustees have adopted a sector specialisation approach, which involves identifying and selecting separate managers for each asset class.
These managers are chosen because of their expertise in that asset class and are therefore expected to add value in each individual asset sector. The Scheme’s investment managers as at 31 March 2023 are shown in the investments table shown on page 4 of the Annual Report.
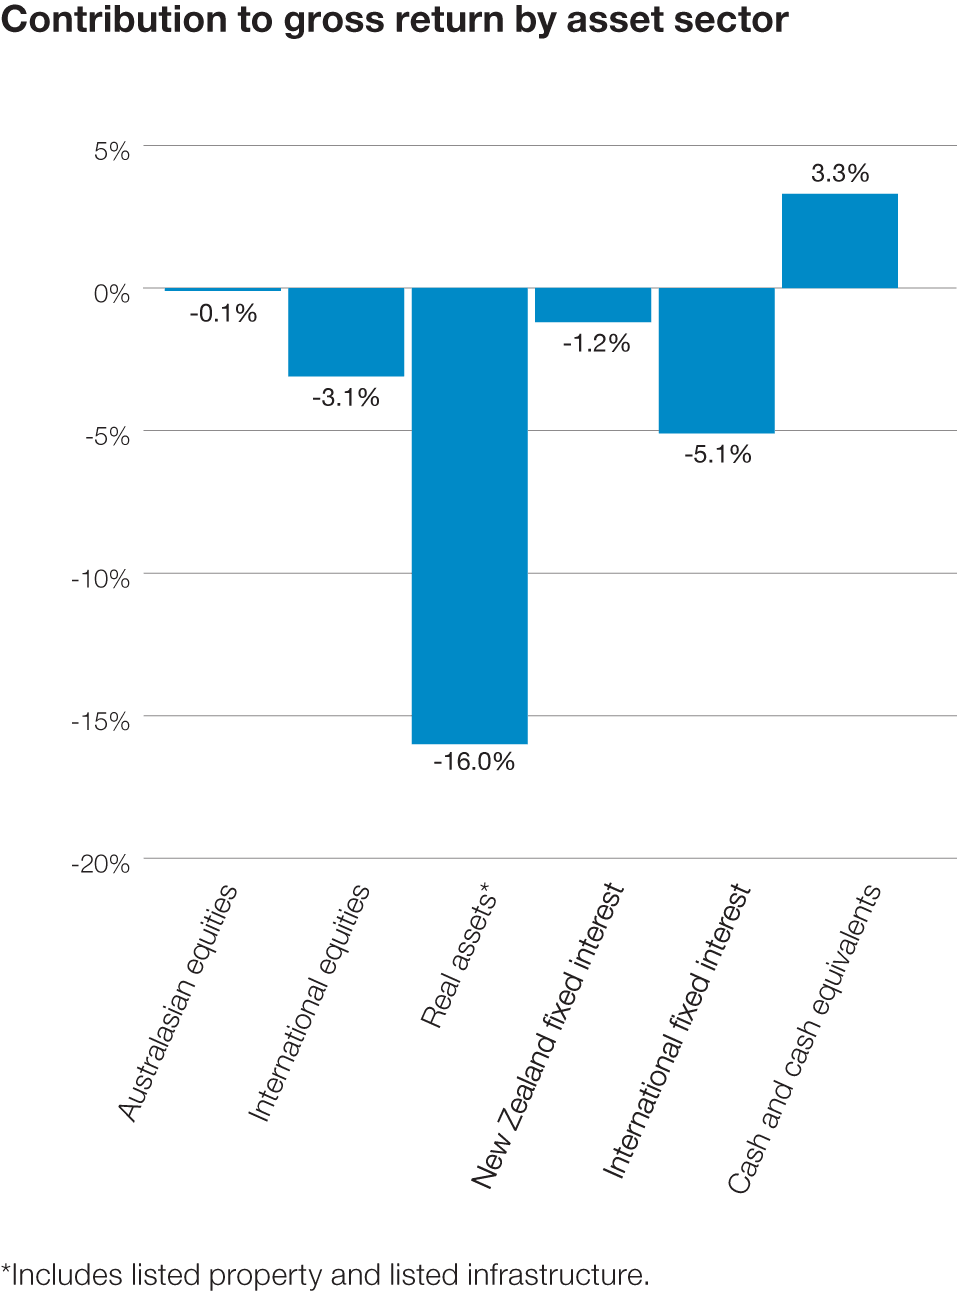
The Scheme’s assets earned -2.86% before tax for the year ended 31 March 2023. The contribution towards this return from each asset sector is shown in the graph below. The percentages are before the deduction of tax, investment management fees and expenses.
Investment Objectives
The Scheme’s long-term investment objectives are:
• over the long term (rolling 10-year periods), to achieve a return after tax and investment fees, that exceeds inflation by 1.25% p.a.
• over a rolling three-year period, to achieve a Scheme return (gross of tax and investment fees) that exceeds the Composite Benchmark Return by 1.0% p.a.
• over a rolling three-year period, to achieve a return (gross of tax and investment fees) in each asset class that exceeds the relevant benchmark index return.
Investment Strategy
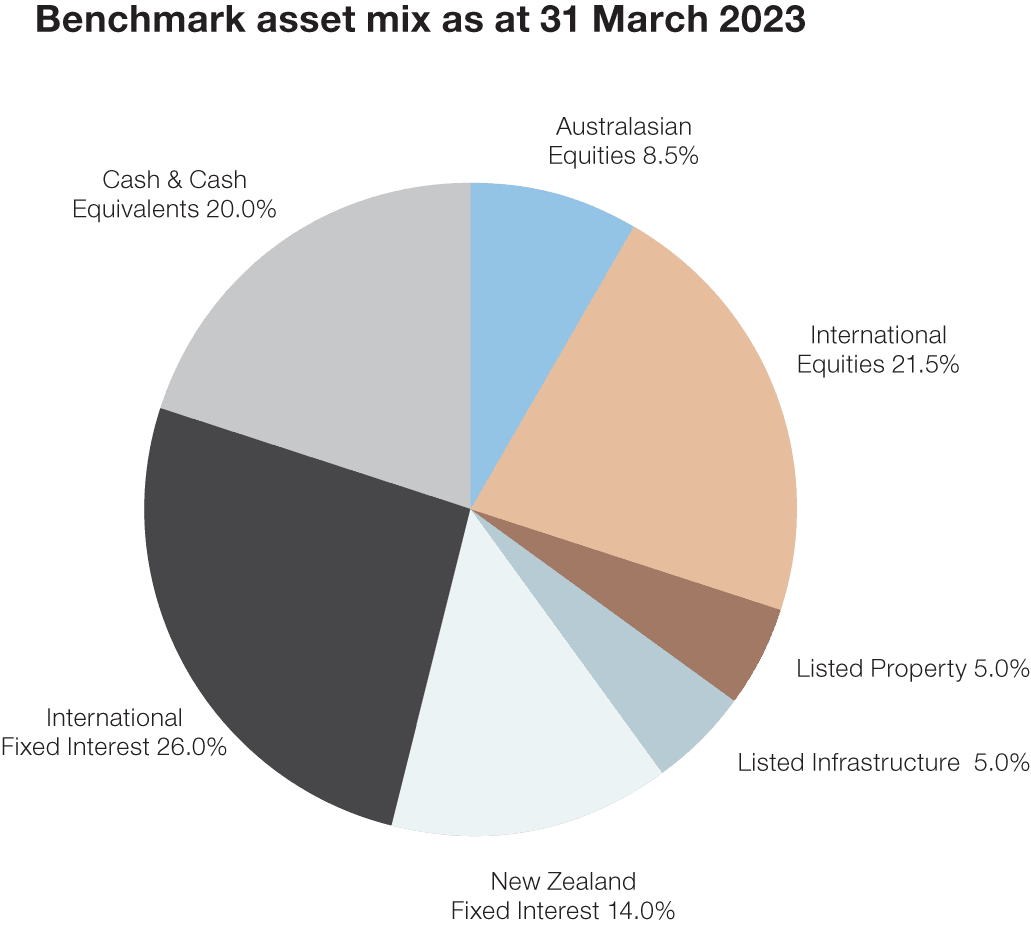
The Trustees set an investment strategy and determine along-term asset mix to enable them to achieve their objectives. This asset mix is known as a ‘benchmark’ and allows the assets to be spread across various asset classes.
Investments as at 31 March 2023
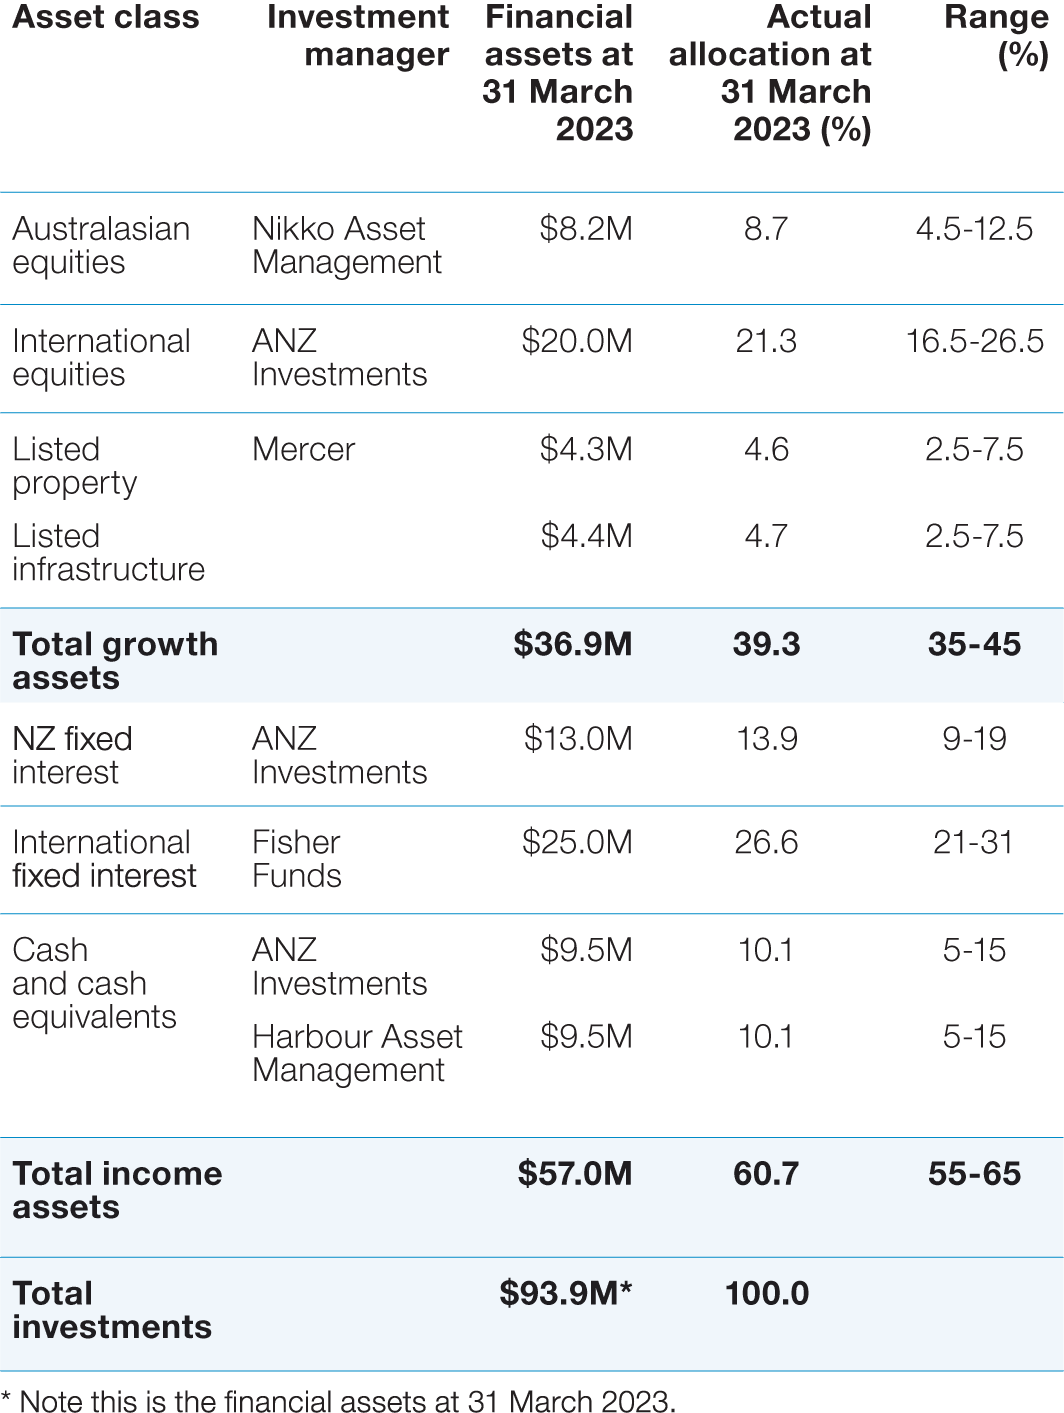
The investment managers’ performance is monitored by the Trustees taking into consideration advice from the investment consultant.
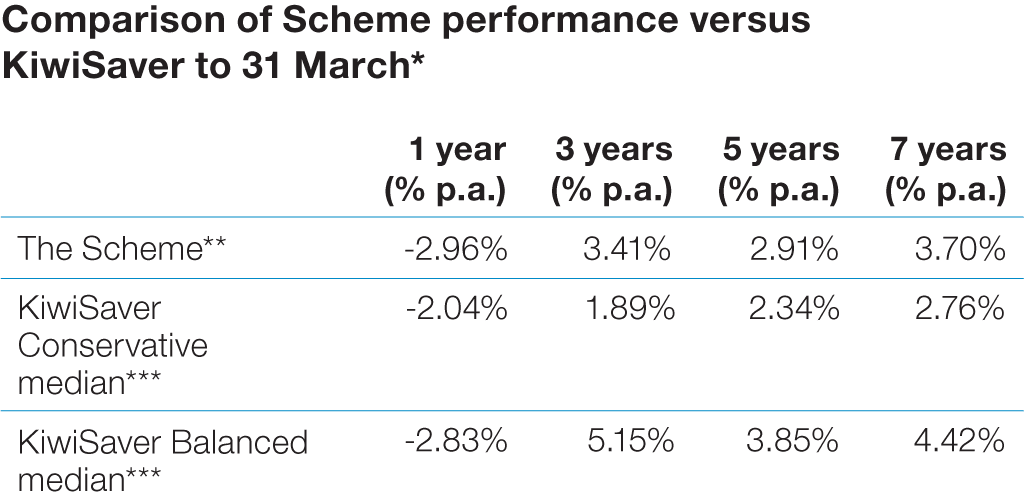
* This table compares MISS Scheme returns against all funds in the Conservative and Balanced sub-universes of the Mercer KiwiSaver Survey as at 31 March 2023. This Survey includes Conservative Funds from 10 KiwiSaver Schemes and Balanced Funds from 10 KiwiSaver Schemes. Not all KiwiSaver Schemes are included in the Mercer KiwiSaver Survey. The MISS Scheme has a strategic asset allocation to growth assets of 40% compared to the Conservative and Balanced sub-universes of the Mercer KiwiSaver Survey which include funds with allocations to growth assets of 20-39% and 40-60% respectively. The Conservative sub-universe does not include KiwiSaver Default Funds, which have their own sub-universe with a strategic asset allocation to growth assets below 20%.
** These returns are after tax & investment management fees and after deduction of expenses and reflect the actual final credited rate.
*** The KiwiSaver median returns are after tax and investment management fees and after deduction of expenses.